Medium Term Trend: ↓Down (Changes to up above 9900)
There is still a lot of scepticism and nervousness which is visible at high levels ( which is understandable). In last post we had mentioned that short term trend has changed to +ve and we need to see if it has powers to change the medium term or reverses back to -ve zone. Today, once 8300 was broken, chances of short term again going back to -ve zone has increased.
There are couple of interesting observations I would like to highlight in todays post so would request everyone to read carefully (and atleast couple of times).
Regular readers of the blog would be aware that Nifty had posted an 'extracting triangle' (in late Feb) which we had mentioned in our 24th Feb post (same can be read here : Nifty update for 25th Feb). below is the chart which we had put.
 |
| Nifty daily ( Feb 2020) |
This was a bearish 'extracting triangle' (more about such formations can be read here: Extracting Triangles) which got completed around 12100-12200 and after its completion Nifty corrected almost 5000 points in 4-5 weeks. Now everyone can see the power of extracting triangle and how it formed during this market top.
Now look at Nifty chart for last few days, there is a possibility that a similar extracting triangle ( bullish this time) is getting formed at lower levels. This has been in formation since Nifty hit a high of 10200 level (on the first freeze day). Here A>C and D>B. So far E is smaller than C ( rallies are getting bigger and falls are getting smaller)
 |
| Nifty Daily |
As long as E remain smaller than C, meaning Nifty doesn't fall below ~7700 levels and then mkt goes on to recover and make a new high above 9100 levels will confirm completion of a bullish extracting triangle. Last extracting triangle created a top can a new one create a bottom? Yes it can provided it indeed turns out to be an extracting triangle ( i.e, E remains smaller C followed up by a faster retracement above 9100 levels)
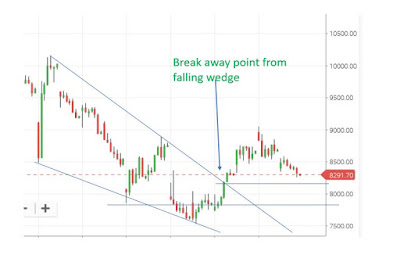
Now lets see another chart. We had also mentioned a possibility of markets completing a contracting wedge recently.
 |
| Nifty Hourly |
Breakout point for this contraction/wedge is around 8150-8200 levels so that should act as an support in near term however if it goes down then the next support will be around 7750-7800 levels which is also the starting point of 'B' leg of extracting triangle (or D leg of contracting wedge). Weakness below 8150 and then 7750 will negate the formation of extracting triangle and wedge (both) but as long as these level stands there is always a chance of market staging a comeback.
In Summary if 8150 or 7750 holds and we see a sharp recovery back above 9100 levels then there is a strong (infact very strong) possibility that bottoming out process is over and done and market is ready to scale new heights. However consistent weakness below 7750 levels will push markets again in deep correction mode time wise ( like we have been mentioning in prior posts). Hence one need to be careful and accordingly trade.
To join our free trial of algorithm based buy/sell whatsapp service during market hours, pls click below link or whatsapp @ 9319321906
No comments:
Post a Comment